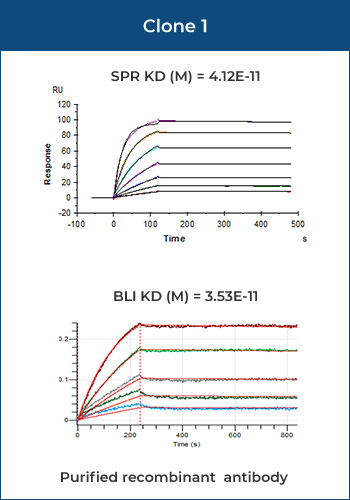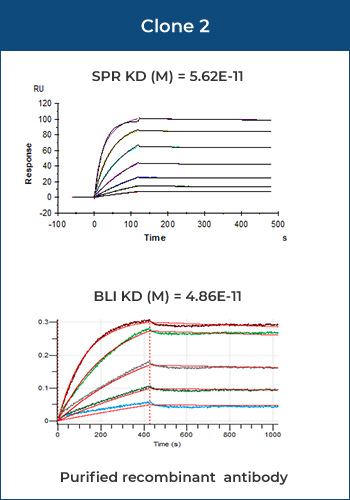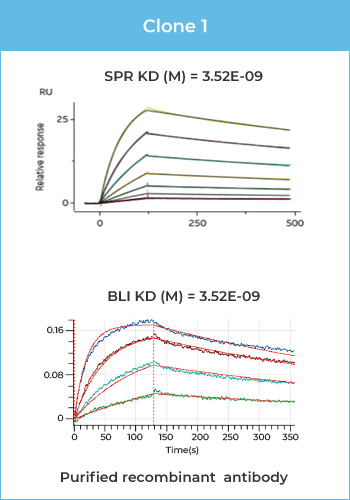


As shown in Fig 1 and Tab 1, SPR has higher sensitivity and a wider affinity detection range than BLI. SPR is suitable for both low-affinity (KD ~µM) and high-affinity (KD ~0.1 nM) samples, which may not be successfully detected by BLI.
Figure 1: Affinity binding curves of human IgG-1, 2, 3
Human IgG-1

Human IgG-2

Human IgG-3

Table 1: Affinity binding detailed analysis report of human IgG-1, 2, 3
| Ab | Chip | Affinity | Test item | Chi² (RU²) | Ka (1/Ms) | kdis (1/s) | KD (M) |
|---|---|---|---|---|---|---|---|
| Human IgG-1 | ProA | Medium | Affinity | 4.90e-02 | 1.39e+05 | 2.07e-03 | 1.49e-08 |
| Human IgG-2 | ProA | High | Affinity | 3.41e-01 | 2.75e+04 | 3.59e-05 | 1.30e-09 |
| Human IgG-3 | ProA | Low | Kinetics | 4.75 | - | - | 3.818e-07 |