


| Qualitative & Quantitative Analysis | ||
|---|---|---|
| Applications | Assay list | Benefits |
| Purity Analysis | SDS-PAGE |
|
| CE-SDS |
|
|
| HPLC |
|
|
| UPLC |
|
|
| Routine molecular weight detection |
Non-deglycosylated detection:
|
|
|
N-glycan removal detection:
|
|
|
| Characterization of heavily glycosylated proteins |
Denatured N-glycan removal detection:
|
|
|
Denatured N-glycan and O-glycan removal detection:
|
|
|
| Characterization of complex formation under the native state |
|
|
| Characterization of the complete protein sequence |
|
|
|
|
|
| Characterization of protein N-terminal and C-terminal sequences |
|
|
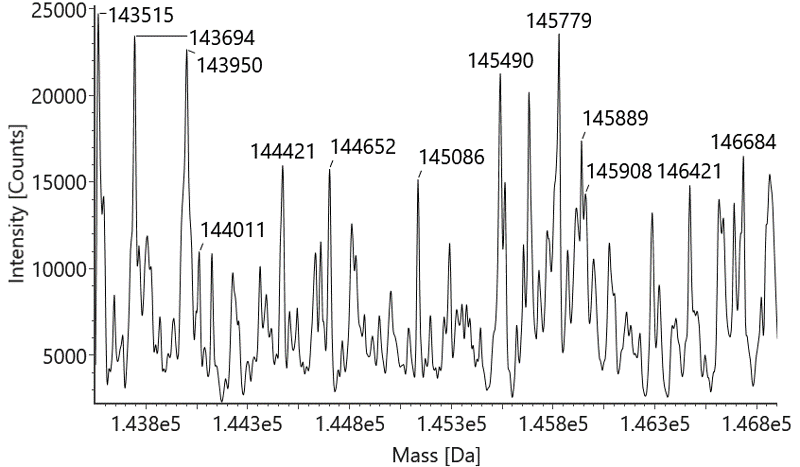
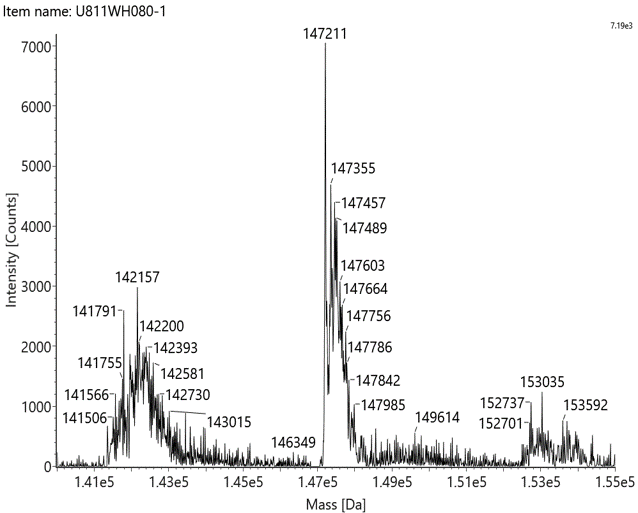
Case 1: Native mass - BsAb – Identification of the non-covalently linked chain
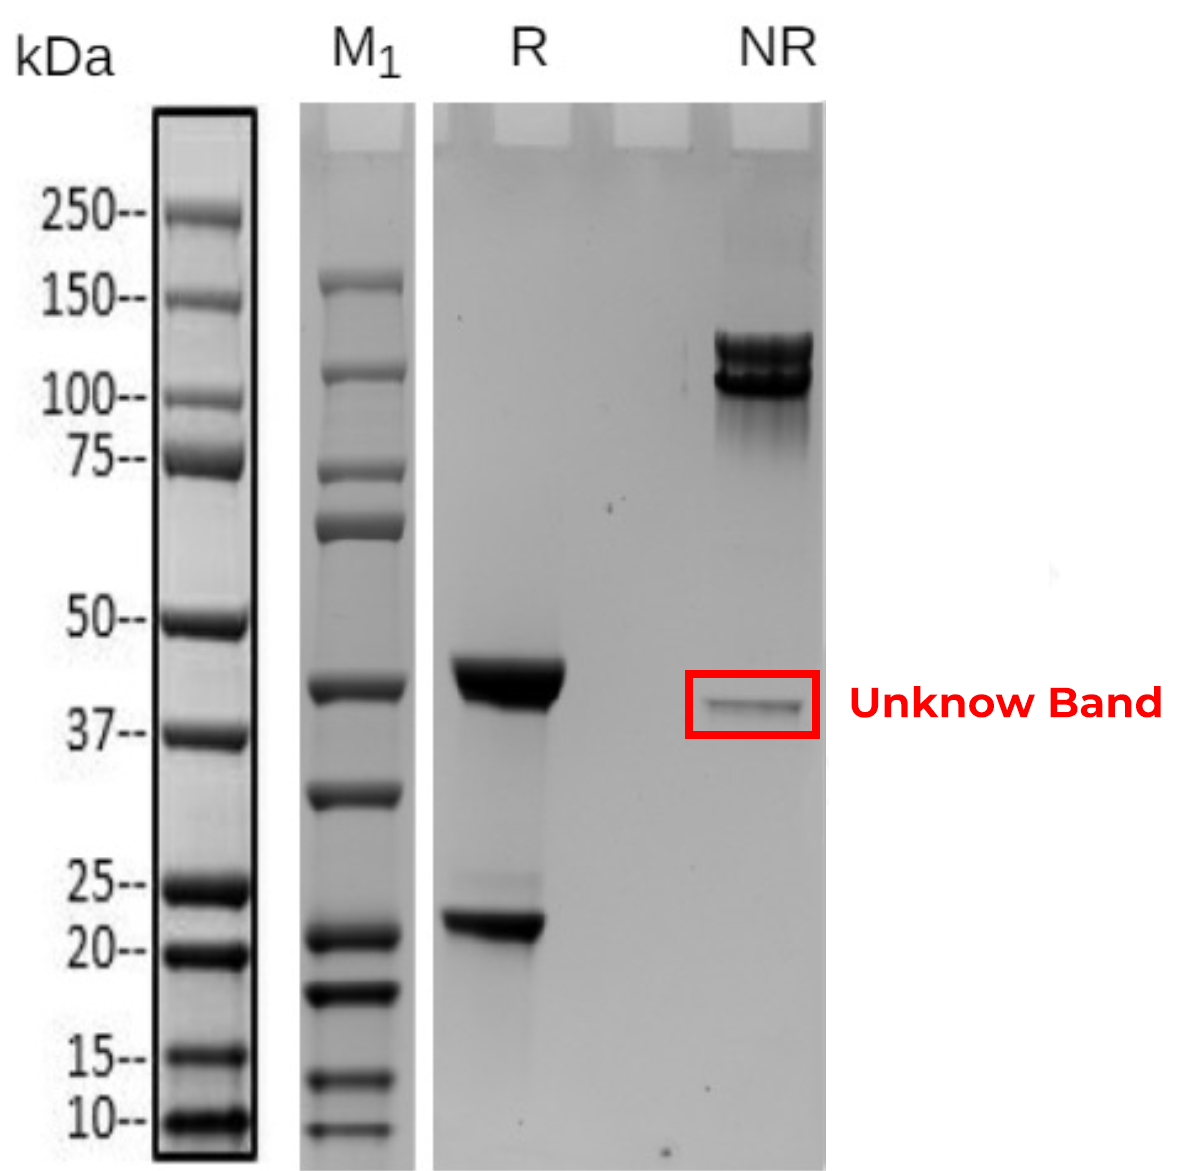
Native mass spectrometry is often used to identify the components of bispecific antibodies. The molecular weights of the marker bands in Fig 1A are 150 kDa, 120 kDa, 100 kDa, 74 kDa, and 23 kDa. Under denaturing conditions, the 150 kDa light chain was not identified by conventional mass spectrometry. This indicates that non-covalent interactions between proteins were disrupted under these conditions (Fig 1B). In contrast, native mass spectrometry reflected the original state of the proteins and successfully identified the light chain (Fig 1C).
Figure 1: SDS-PAGE and Mass analysis of BsAb1
A
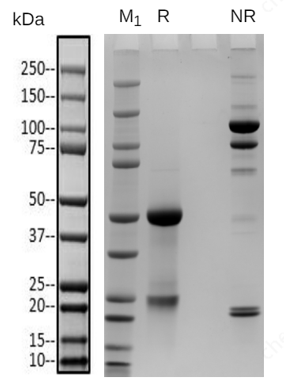
B
C
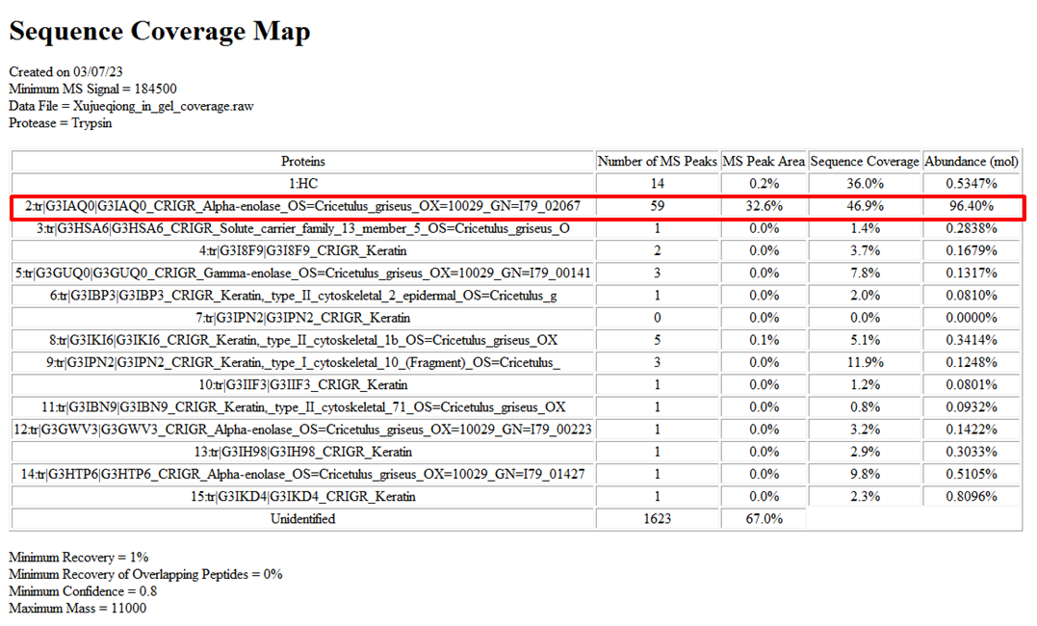
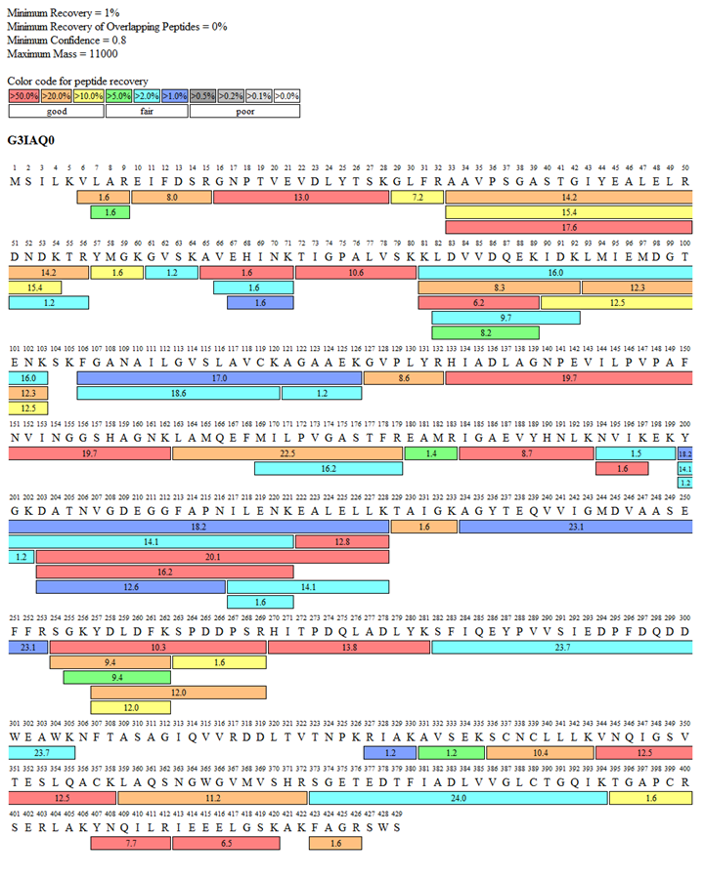
Case 2: In-gel sequence coverage - Biotinylated protein – Identification for low concentration protein
Detection of biotinylation efficiency for protein-1 was requested by the customer. However, its concentration is far below the requirement and it is difficult to concentrate. Nevertheless, the SDS-PAGE bands were relatively clear (Fig 1). By excising the target band from the gel and performing coverage analysis, the biotinylation efficiency was successfully identified (Fig 2, Tab 1).
Figure 1: SDS-PAGE of protein-1
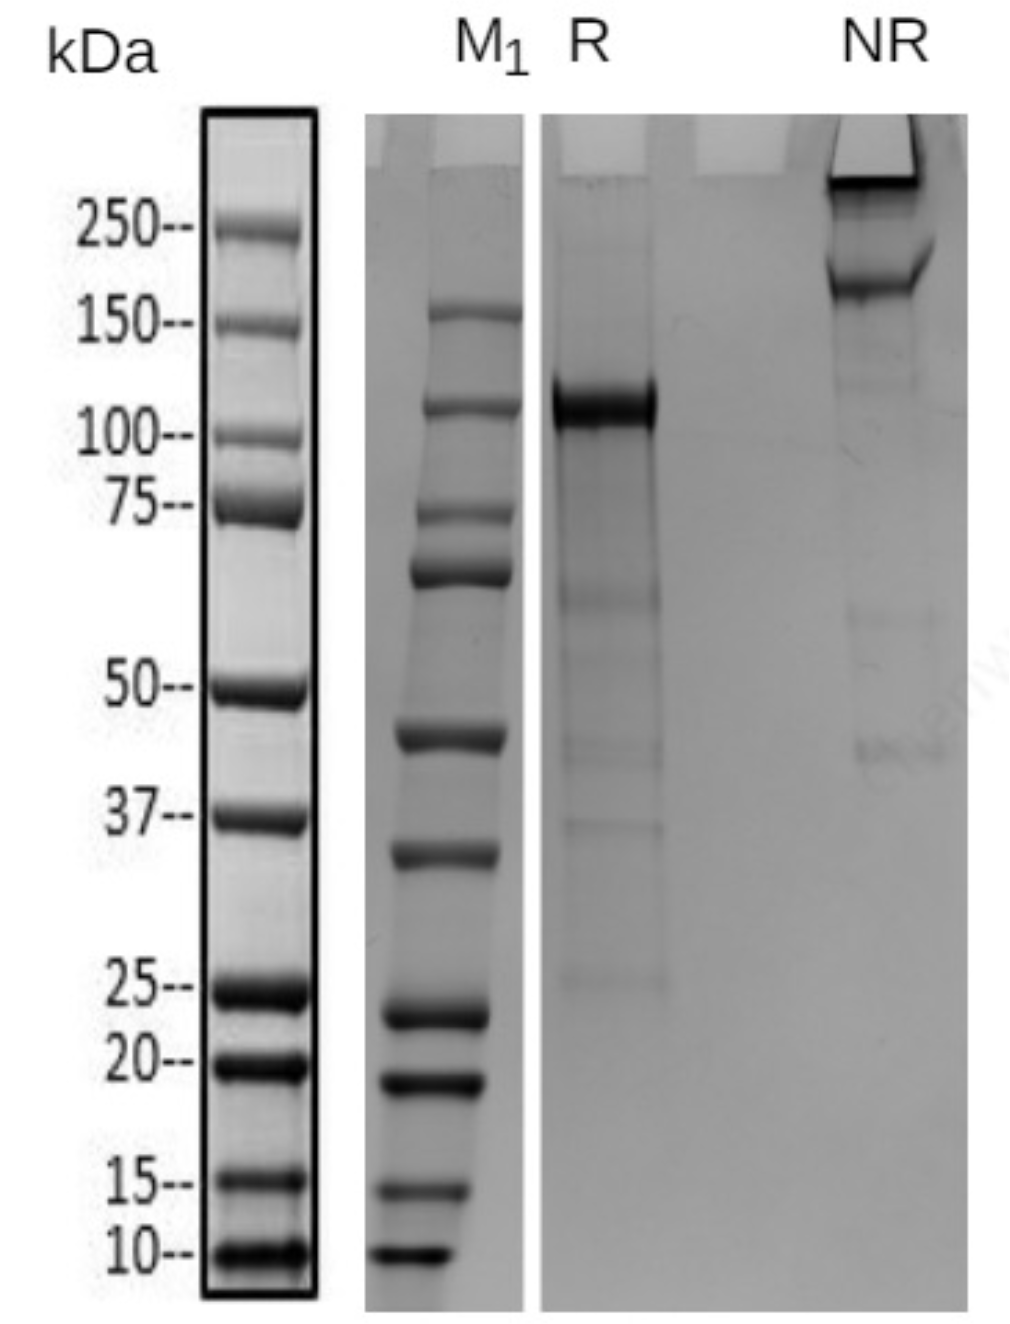
Figure 2: Fragment coverage map of protein-1
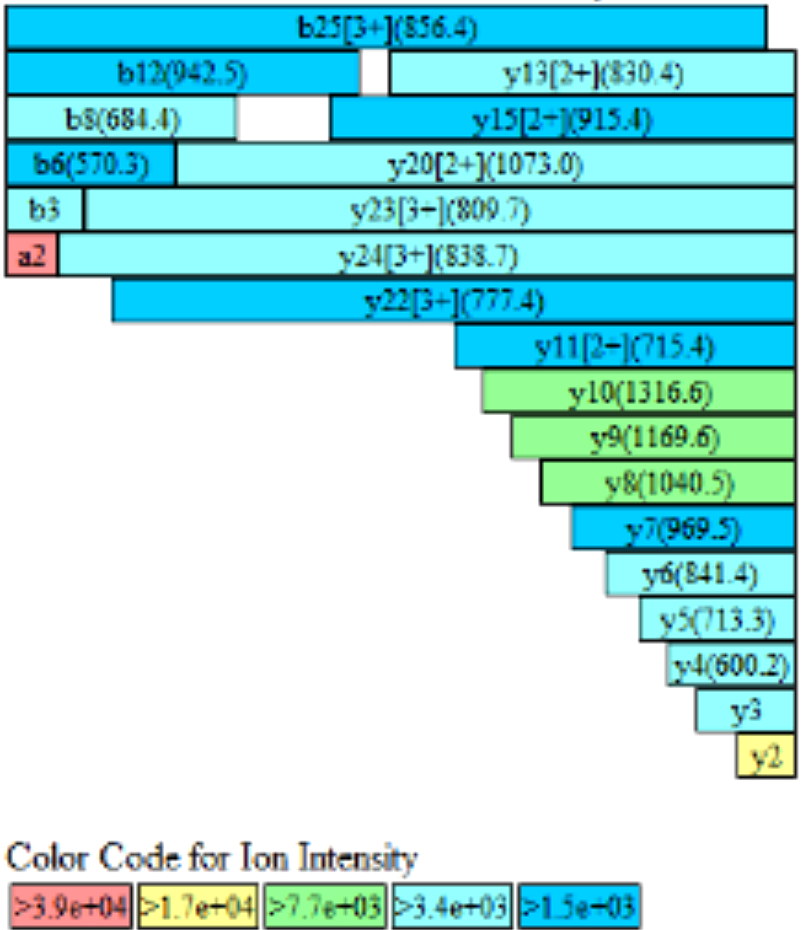
Table 1: Peptide coverage analysis of protein-1
| Site | Mod | M/Z | Charge St. | Mono Mass Exp. | Mono Mass Theo. | △ ppm | Biotinylation ratio % |
| K1296 | Biotinylation | 980.803 | 3 | 2938. 385 | 2938.392 | -2.36 | 99.3 |