| General Properties |
| Applications
|
Assay list
|
Benefits
|
Purity analysis
Default QC for TurboCHO™
|
SDS-PAGE
|
- Traditional methods
- High acceptance
|
Purity analysis
Default QC for TurboCHO™
|
CE-SDS
|
- High accuracy data sourced from quantitative
fluorescence signals
- Automated analysis process with strong data
traceability.
- Relatively high resolution
|
Purity Analysis
Default QC for TurboCHO™
|
HPLC
(Agilent 1260)
|
- Broad applicability, meeting the requirements of most chromatography
columns
|
| Purity Analysis |
UPLC
(Waters H-Class premier)
|
- Capable of withstanding system pressures up to 1000 bar, featuring
ultra-high pressure resistance;
- Bio-inert liquid chromatography system that minimizes sample residue;
- Minimal delay volume
|
| Protein Identification |
| Applications
|
Assay list
|
Benefits
|
| Routine molecular weight detection
|
- Non-deglycosylated detection
- Intact mass
- Reduced mass
|
It can characterize glycosylation, protein assembly,
or the condition of each chain.
|
- N-glycan removal detection
- De-glycosylated mass
- Reduced and de-glycosylated mass
|
After deglycosylation, the protein response is
better, allowing for more accurate assessment of the protein chain, such as
breakage; characterization of bispecific antibody components.
|
| Characterization of heavily glycosylated proteins |
- Denatured N-glycan removal detection
- De-glycosylated mass(denatured)
- Reduced and de-glycosylated mass(denatured)
|
When glycosylation is severe, protein
characterization can still provide information on the overall molecular
weight of the protein.
|
- Denatured N-glycan and O-glycan removal detection
- De-O-glycosylated mass
- Reduced and de-O-glycosylated mass
|
It can simultaneously remove N- and O-glycans to
avoid the impact of N- and O-glycosylation on protein detection.
|
| Characterization of complex formation under the native state
|
Native mass |
The detection conditions are mild and do not disrupt
the natural state of proteins, suitable for the analysis of non-covalently
bonded protein complexes and small protein aggregation.
|
| Characterization of the complete protein sequence |
Sequence coverage |
The protein purity has little impact, and 100%
coverage characterization can be achieved through a combined enzymatic
digestion strategy.
|
| in-gel sequence coverage
|
It can specifically analyze a particular band on the
gel image.
|
| Characterization of protein N-terminal and C-terminal sequences
|
N/C-terminal sequence
|
It can be used to confirm whether the protein has
been fully expressed, to detect if any cleavage has occurred, and to
determine if there have been any modifications to the N-terminal and
C-terminal sequences of the protein.
|
Case1 Native mass - BsAb - Detect the non-covalently
linked
chain that not display
in conventional mass spectrometry
One of the light chains in this bispecific antibody sample is non-covalently linked
to the other chains. Fig 1A shows molecular weights of 150K, 120K, 100K, 74K, and 23K. However,
conventional mass spectrometry, which operates under denaturing conditions, did not detect the
150K signal, indicating that the non-covalent interactions between proteins were disrupted under
these conditions (Fig 1B). In contrast, native mass spectrometry can reflect the original state
of the proteins without disrupting their non-covalent interactions, successfully detecting this
light chain (Fig 1C).
Figure 1 SDS-PAGE and Mass analysis of BsAb1
Case 2 In-gel sequence coverage - Biotinylated protein –
Identification for
low concentration protein
The client requested the detection of biotinylation efficiency for protein-1.
However, its concentration is far below the requirements for molecular weight and solution
coverage in the standard submission guidelines, and it is difficult to concentrate.
Nevertheless, the SDS-PAGE bands were relatively clear (Fig 1). By excising the target band from
the gel and performing coverage analysis, the biotinylation efficiency was successfully
identified (Table 1).
Figure 1 SDS-PAGE of protein-1

Table 1 Peptide coverage analysis of protein-1

| Characterization |
| Applications |
Assay List |
Benefits |
| Characterization of glycoforms
|
Glycosylation mirror comparison |
Pairwise mirror comparison makes the differences in protein
glycoforms and their proportions clear at a glance. Mainly used for screening
and comparing production methods.
|
| Released N-glycan analysis |
Separating glycosylation modifications from proteins avoids
the impact of low protein ionization efficiency, resulting in accurate outcomes.
|
| Characterization of protein modifications
|
Biotinylation ratio (peptide mapping)
|
Targeted enzymatic digestion analysis of the Avi tag can avoid
the influence of the entire protein, ensuring accurate results.
|
| Disulfide bond analysis
|
Analyzing protein disulfide bond formation involves examining
the pairing of cysteine residues and the proportion of different cysteine pairs
forming bonds. It also includes assessing the proportion of free thiol groups
from cysteines that have not formed disulfide bonds.
|
| N-glycosylation site |
Simultaneously provide the information on N-glycosylation
sites and glycosylation modifications (including the types of glycans and their
proportions).
|
- PTM-phosphorylation
- PTM-deamidaton
- PTM-oxidation
|
Simultaneously provide the modification sites on the protein
and the modification proportions.
|
Case1 Glycosylation mirror comparison – Glycoprotein –
Production process
optimization and selection
Ab-1 and Ab-2 are samples of the same protein obtained through different production
processes (with different hosts). As shown in Fig1 & Tab1, Glycan profiling analysis can be used
to study the impact of different production processes on the glycosylation patterns of the
protein, facilitating process optimization and selection.
Figure 1 Reduced Mass analysis of Ab-1 & Ab-2

Table 1 Glycosylation analysis of Ab-1 & Ab-2

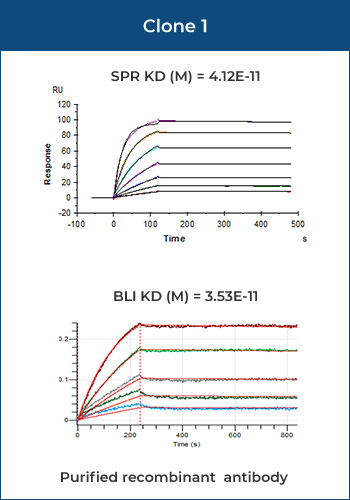
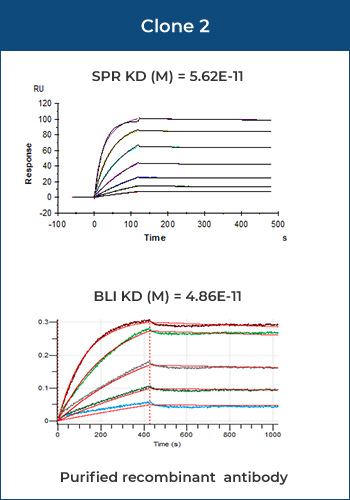
| BLI/SPR >> |
| Applications |
Assay List |
Benifits |
Recommendation |
Antigen-antibody affinity analysis;
Protein-protein/DNA /small molecule interactions;
|
Bio-Layer Interferometry
|
- Target-free, real-time detection, high throughput
- Relatively low cost
- High sample compatibility: suitable for supernatants, tolerant to
organic reagents
- Sample recovery available
|
- For screening expression supernatants, BLI is recommended.
- For samples with moderate affinity (KD µM~nM), the results from BLI and
SPR are comparable.
|
| Surface Plasmon Resonance
|
- Target-free, real-time detection, high throughput
- High sensitivity, broader affinity detection range
- Capable of detecting small molecules (100 Da)
|
- For samples with lower affinity (KD ~µM) and higher affinity (KD ~0.1
nM), SPR is recommended.
|
Case 1 SPR - Human IgG – SPR has a broader affinity
detection
range
As shown in Fig1 & Tab1, for medium-affinity samples (mostly antigen-antibody), the
detection results (KD) of BLI and SPR are almost consistent. For high-affinity samples, due to
limitations in instrument stability and sensitivity, BLI may show artificially high detection
results or fail to detect. For low-affinity samples (fast on and fast off, such as most small
molecules and peptides), due to sensitivity limitations, BLI may fail to detect.
Human IgG-1

Human IgG-2

Human IgG-3

Figure 1 Affinity binding curves of human IgG-1, 2, 3
Table 1 Affinity binding detailed analysis report of
human
IgG-1, 2, 3
| Ab |
Chip |
Affinity |
Test item |
Chi² (RU²) |
Ka (1/Ms) |
kdis (1/s) |
KD (M) |
| Human IgG-1 |
ProA |
Medium |
Affinity |
4.90e-02 |
1.39e+05
|
2.07e-03
|
1.49e-08
|
| Human IgG-2 |
ProA |
High |
Affinity |
3.41e-01 |
2.75e+04
|
3.59e-05 |
1.30e-09 |
| Human IgG-3 |
ProA |
Low |
Kinetics |
4.75 |
- |
- |
3.818E-07 |
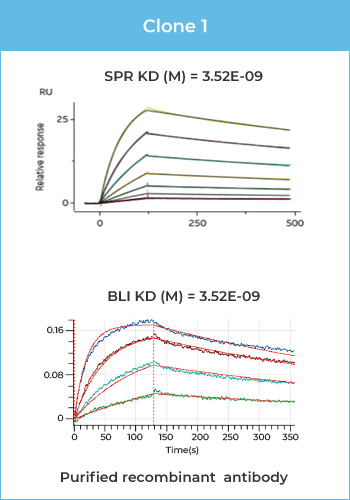
Case2 BLI v.s. SPR – IgG Affinity - BLI and SPR results
are
comparable for
most Ab-antigen interactions.
Rabbit IgG
Rabbit IgG
Mouse IgG
| Impurity |
| Applications |
Test Items |
Benefits |
| Host cell protein analysis |
ELISA or LCMS |
By analyzing host proteins in the sample, identify the host
protein types and provide valuable insights for upstream production and
downstream applications.
|
| Residual DNA |
qPCR based |
/ |
| Residual Protein A |
ELISA |
/ |
Case 1 Host cell protein analysis – Impurity protein –
SDS-PAGE unknown band
Identification
An unknown band was detected in several production batches of the protein (Fig 1).
After ruling out protein contamination, it was suspected that this band was a host cell protein
(HCP). The band was excised from the gel and subjected to HCP analysis, which revealed a high
degree of similarity to phosphopyruvate hydratase (Tab 1). Further matching of the host protein
sequence showed an overall sequence coverage of 90.9%, confirming that the band was the host
protein phosphopyruvate hydratase (Fig 2).
Figure 1 SDS-PAGE of expression sample

Table 1 Sequence coverage map report of the unkown band

Figure 2 Sequence coverage map of the unkown band

 Most Popular Products
 CRISPR Gene Editing
 Antibodies
 Protein Electrophoresis and Blotting
 Molecular Biology
 Stable Cell Lines
 Cell Therapy
 Diagnostics
 Resources